
Identify processes and connections • Learners are able to: - transfer mathematical skills across the curriculum in a variety of contexts and everyday situations - select, trial and evaluate a variety of possible approaches and break complex problems into a series of tasks - prioritise and organise the relevant steps needed to complete the task or reach a solution - choose an appropriate mental or written strategy and know when it is appropriate to use a calculator - use a scientific calculator to carry out calculations effectively and efficiently using the available range of function keys - identify, measure or obtain required information to complete the task - identify what further information might be required and select what information is most appropriate - select appropriate mathematics and techniques to use - estimate and visualise size when measuring and use the correct units - develop and evaluate mathematical strategies and ideas creatively - consider connections between mathematical skills and contextualise these within extended tasks
Add and Subtract Decimals
Add and Subtract Decimals Up to 10
Add and Subtract Decimal Up to 100
Multiply Decimals and Whole Numbers
Divide Decimals by Whole Numbers
Mixed Decimal Equations
Maps with Decimal Distances
Add and Subtract Mixed Numbers
Multiply Fractions by Whole Numbers
Multiply Fractions by Whole Numbers
Divide Fractions and Mixed Numbers Up to 1/16, 1/32
Divide Fractions and Mixed Numbers Up to 1/32
Divide Fractions and Mixed Numbers
Divide Fractions and Mixed Numbers Up to 1/16
Mixed Fraction Equations Up to 10
Mixed Equations with Fractions, Mixed Numbers
Equivalent Ratios
Scale Drawings and Scale Factors
Percents of Numbers
Percents with Multi-Step Problems
Percent Equations
Mixed Equations with Money Amounts
Sale Prices: Find the Original Price
Estimate Tips
Simple Interest
Compound Interest
Estimate Mixed Equations
Multi-Step
Guess and Check
Algebra: Linear Function with Intercepts
Linear Function
Two-Variable Equations
Interpret Double Bar Graphs
Interpret Line Graphs
Interpret Bar Graphs
Interpret Double Line Graphs
Circles
Rate of Change
Interpret Line Plots
Interpret Line Plots with Numbers Up to 40
Interpret Line Plots with Up to 5 Data Points
Interpret Stem and Leaf Plots
Convert Graphs to Input/Output Tables
Interpret Box-And-Whisker Plots
Scatter Plots
Interpret Charts to Find Mode
Interpret Charts to Find Mean, Median, Mode, and Range
Interpret Charts to Find Median
Interpret Charts to Find Range
Interpret Charts to Find Mean
Making Predictions
Prediction Problems
Counting Principle
Evaluate Multi-Variable Expressions
Simplify Variable Expressions Using Properties
Simplify Variable Expressions
Represent and communicate • Learners are able to: - explain results and procedures precisely using appropriate mathematical language - refine methods of recording calculations - use appropriate notation, symbols and units of measurement, including compound measures - select and construct appropriate charts, diagrams and graphs with suitable scales - interpret graphs that describe real-life situations, including those used in the media, recognising that some graphs may be misleading - evaluate different forms of recording and presenting information, taking account of the context and audience - generalise in words, and use algebra, to describe patterns that arise in numerical, spatial or practical situations
Review • Learners are able to: - select and apply appropriate checking strategies - interpret answers within the context of the problem and consider whether answers, including calculator, analogue and digital displays, are sensible - verify and justify results or solutions, including discussion on risk and chance where relevant - interpret mathematical information; draw inferences from graphs, diagrams and data, including discussion on limitations of data - draw conclusions from data and recognise that some conclusions may be misleading or uncertain - justify numerical and algebraic results, making appropriate connections - explain and justify strategies, methods, reasoning and conclusions in a variety of different ways, including orally, graphically, in writing (both in mathematical notation and without), and using appropriate digital literacy equipment - appreciate the difference between mathematical explanation and experimental evidence; recognise inconsistencies and bias
Round Decimals
Estimate Sums and Differences of Decimals Up to 100
Estimate Sums, Differences and Products of Decimals
Estimate Products of Decimal Numbers
Estimate Sums and Differences of Mixed Numbers
Estimate Products of Fractions and Mixed Numbers
Estimate Positive and Negative Square Roots
Estimate Percents of Numbers
Evaluate Variable Expressions with Whole Numbers
Identify Biased Samples
Identify Representative Samples
Identify Random Samples
Identify Representative, Random, and Biased Samples
Solve Equations Using Properties

Length, weight/mass, capacity • Learners are able to: - find circumferences of circles - use the common units of measure, convert between related units of the metric system and carry out calculations - use rough metric equivalents of imperial units in daily use - recognise measurements that are discrete and those that are continuous - interpret conversion graphs
Time • Learners are able to: - interpret fractions of a second appropriately - interpret time expressed as decimals and fractions and enter them appropriately on a calculator - use timetables and time zones to calculate travel time
Temperature • Learners are able to: - convert temperatures between appropriate temperature scales
Area and volume Angle and position • Learners are able to: - calculate areas of compound shapes (e.g. consisting of rectangles and triangles) and volumes of simple solids (e.g. cubes and cuboids) - find areas of circles - devise and use formulae to calculate the area of trapezia and kites - calculate volumes of prisms constructed from cuboids, e.g. within an L-shaped cross-section - explore angles on parallel lines - understand exterior angles of triangles - know and use the angle properties of quadrilaterals - find horizontal and vertical distances using coordinates - use bearings to describe the location of one object in relation to another - use compass bearings and grid references to specify location
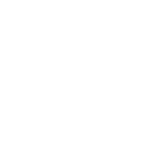
Use number facts and relationships • Learners are able to: - recognise and apply key mental facts and strategies - use known facts to derive others, e.g. use 7 x 6 to derive 0.7 x 6 - use the terms cube, cube root and reciprocal - express cube numbers using powers - express repeated multiplications as powers, e.g. 7 x 7 x 7 x 7 x 7 x 7 = 7?
Prime and Composite Numbers
Divisibility Rules with Numbers Up to 10,000
Divisibility Rules with Dividend Up to 10,000,000
Divisibility Rules
Understanding Integers
Integers: Understanding Integers
Multiply and Divide Decimals by Powers of Ten
Reciprocals
Cube Roots of Perfect Cubes
Understanding Exponents
Evaluate Exponents
Fractions, decimals, percentages and ratio • Learners are able to: - use equivalence of fractions, decimals, and percentages to select the most appropriate for a calculation - simplify a calculation by using fractions in their simplest terms - express recurring decimals using correct notation - calculate a percentage, fraction, decimal of any quantity with a calculator where appropriate - calculate the outcome of a given percentage increase or decrease - express one quantity as a percentage of another - simplify ratios including those given in different units - use ratio and proportion to calculate quantities - add, subtract, multiply and divide fractions
Convert Between Decimals and Fractions or Mixed Numbers
Convert Between Percents, Fractions and Decimals
Choose the Equivalent Fraction Up to Twentieths
Choose the Equivalent Fraction
Reducing Fractions to Lowest Terms
Reduce to Lowest Terms
Percents of Numbers and Money Amounts
Percent Change
Constant of Variation
Percent Equations
Equivalent Ratios
Unit Rates
Compare Ratios
Solving Proportions
Find the Constant of Variation
Solving Proportions
Estimate Using Proportions
Add and Subtract Fractions
Add and Subtract Mixed Numbers
Multiply Fractions with Models
Multiply Fractions
Divide by Fractions with Models
Divide Unit Fractions by Whole Numbers Up to 20 I
Divide Fractions Up to 1/5, 1/7, 1/9
Calculate using mental and written methods • Learners are able to: - use efficient written methods to add and subtract numbers with up to 2 decimal places - use efficient methods for multiplication and division of whole numbers and decimals, including decimals such as 0.6 or 0.06 - use the order of operations including brackets - multiply and divide with negative numbers using mental methods
Add and Subtract Decimal Numbers
Mixed Equations with Decimals
Multiply Decimals with Numbers Up to 100
Multiply Decimals
Divide Decimals
Order of Operations
Simplify Expressions Involving Integers
Evaluate Expressions Involving Integers
Evaluate Expressions with Decimals
Integer Multiplication and Division Rules
Multiply and Divide Integers
Complete the Mixed Equation Sentence
Multiply and Divide Rational Numbers
Estimate and check • Learners are able to: - use rounding to estimate answers to a given number of significant figures - present answers to a given number of significant figures
Manage money • Learners are able to: - carry out calculations relating to VAT, saving and borrowing - appreciate the basic principles of budgeting, saving (including understanding compound interest) and borrowing - calculate using foreign money and exchange rates
Number sequences • Learners are able to: - use algebra to express the nth term rule of a linear sequence - use the nth term rule to find particular terms - use the nth term rule to generate a sequence
Expressions and formulae • Learners are able to: - know that a x a = a² - know that 2a x a = 2a² - substitute positive and negative whole numbers into one and two step expressions - simplify expressions involving the addition and subtraction of two or more variables, including those where one or more of the simplified variables is negative - expand a single bracket - rearrange formulae involving two variables
Functions and graphs • Learners are able to: - express output generated from function machines, taking into account the order of operations - generate and plot points for linear functions
Equations and inequalities • Learners are able to: - solve equations including those where the solution is a negative, a fraction or a decimal and those that include brackets () - give a set of solutions from an inequality with two boundaries and show them on a number line - express a set of numbers as an inequality - complete and interpret simple information and distance - time graphs, showing an understanding of gradients within the context of the question
Solve One-Step Linear Equations
Solve Two-Step Linear Equations
Solve Equations Involving Like Terms
Solutions to Variable Inequalities
Variable Inequalities
Solve One-Step Linear Inequalities
Solve One-Step Linear Equations
Solve Two-Step Linear Equations
Solve Two-Step Linear Inequalities

Shape • Learners are able to: - classify quadrilaterals - explore the tessellation of two shapes - recognise shapes that will or will not tessellate
Construction • Learners are able to: - recognise and draw accurate nets of prisms - represent 3D shapes on isometric paper and draw plans and elevations of 3D shapes made out of cubes - construct triangles given three lengths, using a ruler and compasses - identify sets of lengths that cannot form a triangle
Movement • Learners are able to: - explore symmetrical properties of 3D shapes; identify planes of symmetry - enlarge shapes on square paper where the scale factor is a positive whole number

Collect and record data Present and analyse data Interpret results • Learners are able to: - plan how to collect data to test hypotheses - construct a wide range of graphs and diagrams to represent discrete and continuous data - construct frequency tables for sets of data in equal class intervals, selecting groups as appropriate - construct graphs to represent data including scatter diagrams to investigate correlation - interpret diagrams and graphs to compare sets of data - find the mean, median, mode and range from ungrouped frequency tables - use mean, median, mode and range to compare two distributions (continuous data)
Probability • Learners are able to: - show that the sum of all probabilities = 1 - recognise that some outcomes cannot occur simultaneously, e.g. a coin cannot show heads and tails at the same time - know that events that have two outcomes are not necessarily equally likely - complete a sample space diagram and a two way table - estimate the number of successes of an event, e.g. rolling a fair dice 300 times, how many 3s would be expected?